Homelessness in the U.S. has been on the rise since 2017, experiencing an overall increase of 6 percent.Image

The 2023 edition of the State of Homelessness report shows that, according to the January 2022 Point-in-Time (PIT) count, 582,462 people were experiencing homelessness across America. Using data from the U.S. Department of Housing and Urban Development (HUD), the National Alliance to End Homelessness provides an overview of the scope of the issue in the U.S., illustrating emerging trends. Some key facts:

  • Homelessness has been on the rise since 2017, experiencing an overall increase of 6 percent.
  • In 2022, counts of individuals (421,392 people) and chronically homeless individuals (127,768) reached record highs in the history of data collection.
  • Unsheltered rates are also trending upward, impacting most racial, ethnic, and gender subgroups.
  • Homeless services systems continued to expand the availability of both temporary and permanent beds in 2022, but these resources still fall short of reaching everyone in need.
  • Homelessness rose by a modest 0.3% from 2020 to 2022, a period marked by both pandemic-related economic disruptions and robust investments of federal resources into human services.

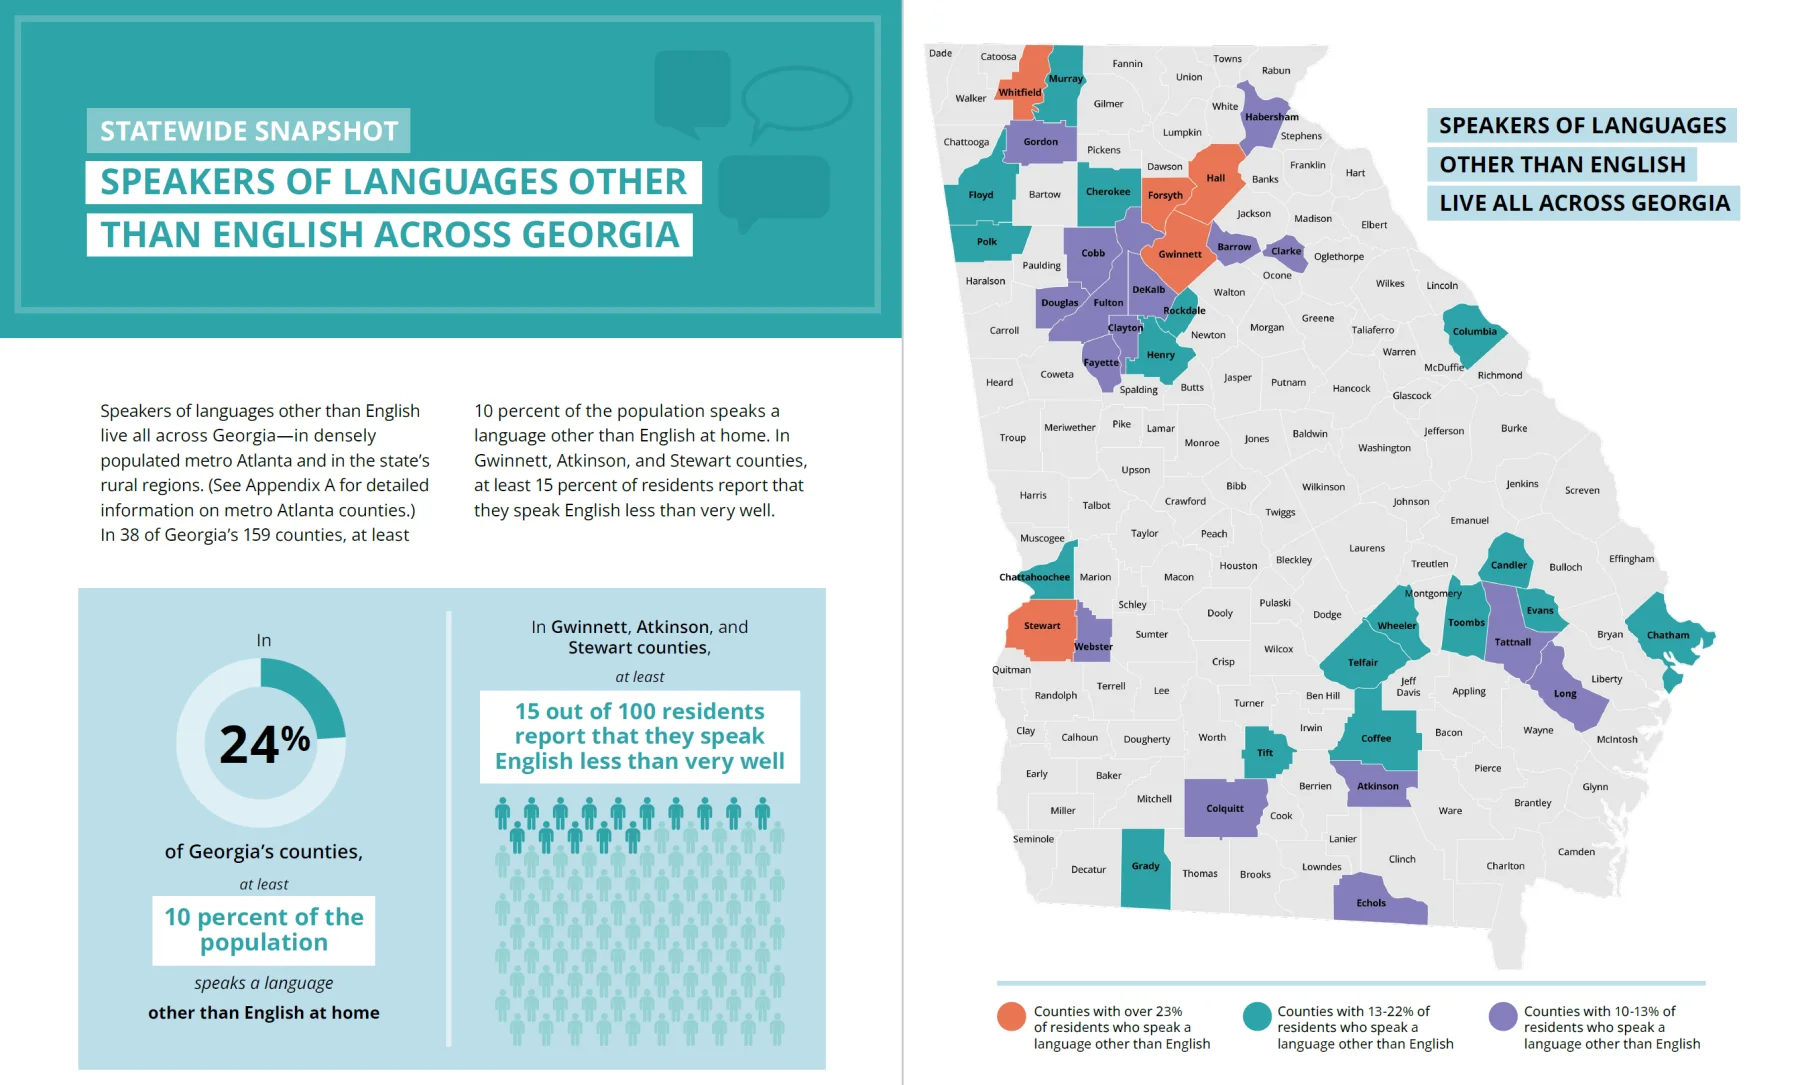
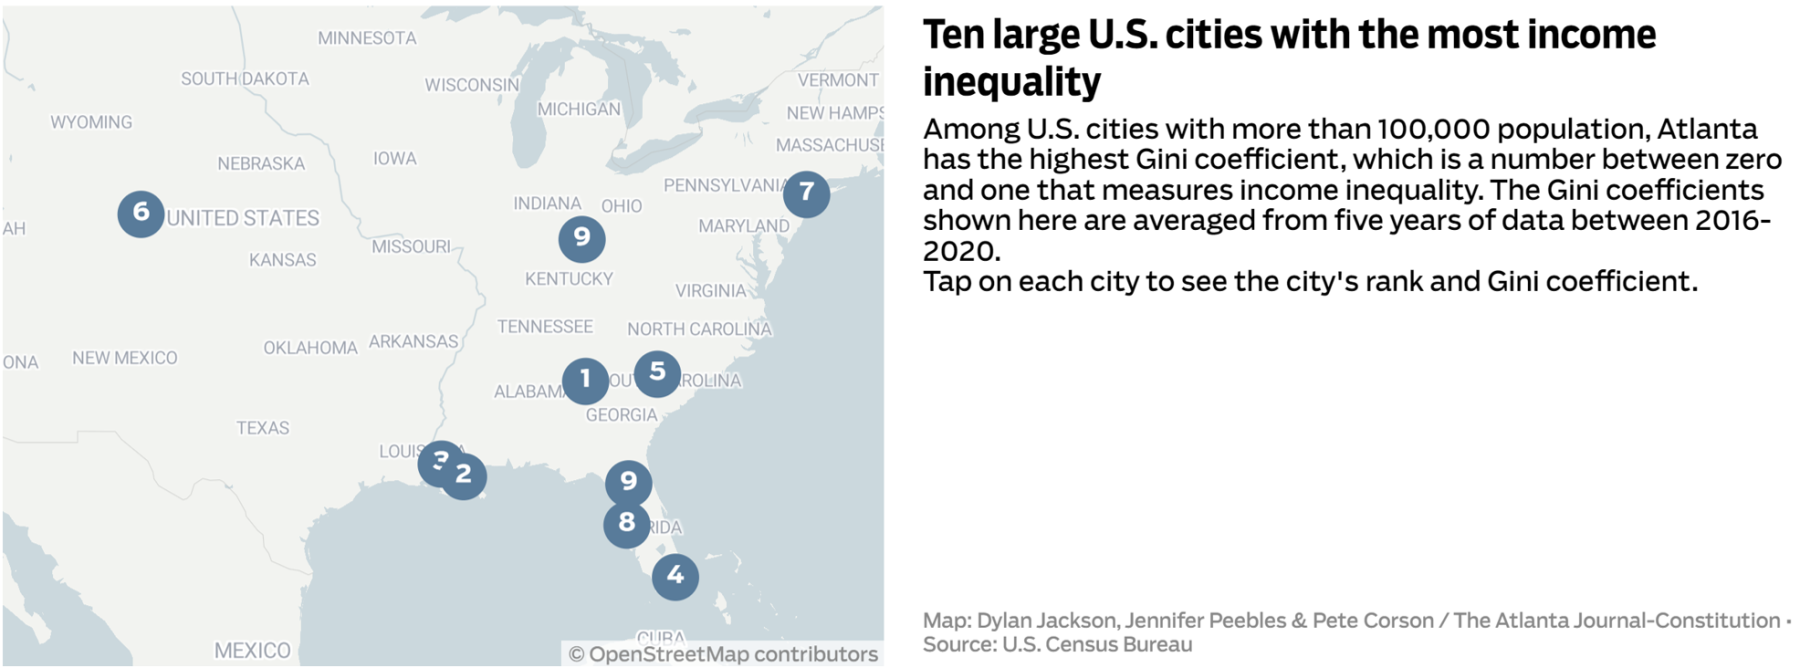
Explore Georgia’s COC dashboards here.

A note on the data: Point-in-time data are one of two common ways to quantify the homeless population. The other is through school districts as mandated by the Federal McKinney-Vento Act. Keep both sources and their definitions of homelessness in mind when analyzing this kind of data.

June 26, 2023 / Equity

Some 17% of adult Americans younger than 30 identify as lesbian, gay or bisexualImage

As the United States LGBTQ+ Pride month comes to an end, the Pew Research Center shared five key findings about LGBTQ+ Americans from some of their recent surveys tracking LGBTQ+ topics such as gender identity, attitudes toward same-sex marriage, and experiences of LGBTQ+ Americans:

  1. Some 7% of Americans are lesbian, gay or bisexual.
  2. More Americans identify as bisexual than as gay or lesbian.
  3. Bisexual adults are far less likely than gay or lesbian adults to be “out” to the important people in their life.
  4. Some 1.6% of U.S. adults are transgender or nonbinary – that is, their gender differs from the sex they were assigned at birth.
  5. While a relatively small share of U.S. adults are transgender or nonbinary, many Americans say they know someone who is.
May 9, 2023 / Equity, Immigration, Policy

The 2020 census may have missed a large share of noncitizensInsight

A recent US Census Bureau study of government administrative data “designed to improve coverage of historically undercounted population groups” found the potential for a significant undercount of noncitizens in the 2020 Census.

NPR’s Hansi Lo Wang explains:

That gap, researchers found, was likely driven by noncitizen residents who are missing from the agency’s count, especially those with “unknown legal status.” About 19.7% of noncitizens tallied in the simulation using administrative records had addresses that could not be matched with those counted in the 2020 census.

That raises ‘the possibility that the 2020 Census did not succeed in collecting data for a significant fraction of noncitizens residing in the United States,’ the bureau’s report says.”

Undercounts lead to underrepresentation and subsequently misrepresentation in standard population data. If you work with “hard to count” populations—children under five, noncitizens, people of color, rural residents—it is imperative you go beyond population data when designing programs, policies, and funding strategies.

April 27, 2023 / Education

Burnout is the main reason why just over half of Georgia teachers are unlikely to stay in educationImage

During their 8th Grade Math Network meeting earlier this month, Learn4Life presented insights from the 2022 Professional Association of Georgia Educators (PAGE) legislative survey. Nearly 4,600 educators participated in the survey, demonstrating the value of educators’ input in critical educational decisions at the state and local levels. Some of the key findings include:

  • Approximately 31%of all responding educators report that they are unlikely to remain in education for another five years.
  • More than 56% of educators with 20 years or less experience identified burnout as the first or second reason they are unlikely to stay in education.
  • About 93% of participating teachers report their school districts have difficulty recruiting substitutes.
  • Over 90% of school and central office administrators indicate their districts are facing a shortage of bus drivers.
  • Nearly 75% of teachers who graduated from college in 2005 or later carry student loan debt.

Despite these challenges, educators are drawn to and stay in education because of the professional satisfaction from helping students, employment benefits, and supportive colleagues and a positive work environment.

April 26, 2023 / Early Childhood

Gaps in access to early learning programs are region-wideImage

GEEARS recently commissioned Reinvestment Fund to update its ATL ACCESS Map. The ATL ACCESS (or Atlanta Child Care and Early Learning Supply Status) study analyzes regional supply and demand data to better understand where early education programs are most needed.

The key takeaway from the latest study: There is a near universal gap in Quality Rated programs across the five-county Atlanta region.

This supply, demand, and gap data can be found in the ATL ACCESS layer of the new Readiness Radar tool.

Estimating ACEs risk and protective factors statewideImage

Emory University’s recently launched Georgia Preventing Adverse Childhood Experiences: Data to Action (PACE: D2A) webpage allows for exploring data related to adverse childhood experiences (ACEs), student achievement, risk and protective behaviors, and much more.

Users can explore dozens of indicators in multiple layers using the friendly mapping interface and displaying relevant demographic and socioeconomic variables.

One of the key elements of this tool is the use of GaDOE’s student health survey to estimate ACEs risk and protective factors statewide.

Learn more about the project and explore the map here.

March 24, 2023 / Commuting, Workforce

Trend alert: Having a formal remote work policy.Image

Georgia Commute Options (GCO) shared the results of their latest Remote Work Survey with three key findings:

  1. There is a strong demand for a hybrid, flexible future: employees prefer to work from home, on average, 3.6 days per week.
  2. Commuting is a top barrier for in-office work: two-thirds of respondents reported their commute as a key factor impacting their willingness to go into the office.
  3. Return-to-office plans are becoming clearer: 63% of organizations now have a formal remote work policy.

See how employees’ and employers’ preferences have changed over the last 2.5 years and more information about commute trends on GCO’s website.

March 1, 2023 / Health, Mental Health, Victims

Youth mental health trendsImage

The CDC released its latest Youth Risk Behavior Survey Data Summary and Trends Report. This is a comprehensive view of health indicators for school-age children.

Moving in the right direction:

  • risky sexual behavior
  • substance use
  • bullying at school

Moving in the wrong direction:

  • protective sexual behaviors
  • violence
  • mental health
  • suicidal thoughts and behaviors


The greatest disparities seem to be between males and females, where female youth are experiencing significantly worse mental health outcomes. This year’s report also breaks down racial disparities more comprehensivel thn ever before.

The State of Black GeorgiaImage

The State of Black Georgia is an educational tool and call to action for Black Georgians, public and private sector stakeholders and the general public that can inform civic engagement, non-profit organizations, elected officials, businesses, policy makers, grass roots organizations, philanthropists, faith-based organizations, researchers, advocates, and other key stakeholders. Together, we can promote inclusive economic development, influential partnerships, and implementation of best practice models that foster overall improvement in conditions for Georgia’s Black residents and the state as a whole.”

From the report:

  • The median wealth of Blacks will fall to zero by 2053 if no action is taken.
  • The percentage of Georgia Black students failing to read at third-grade level was 36%, a 25%
  • increase over the pandemic.
  • Approximately 50% of the inmates admitted in the Georgia Department of Corrections in 2021
  • were Black, yet Black Georgians make up 32% of the State’s population.
  • Fifty-four percent of infant deaths were Black children.
January 26, 2023 / Basic Needs, Housing

Demand for rental assistance on the riseImage

Based on 2-1-1 service requests, the demand for rental assistance has been on the rise through the holiday season. Service requests are largely concentrated in South Fulton zip codes.

Explore the data in the right panel of this page or with the full dashboard. This data is provided by United Way of Greater Atlanta and is updated monthly.

If you are in need of housing assistance or other services, call 2-1-1 or visit 211online.unitedwayatlanta.org.

January 25, 2023 / Economics, Equity, Health

Economic inequality is a life or death issueImage

Looking at the factors that contribute to (and/or result from) Atlanta’s ranking as #1 in economic inequality, a clear pattern emerges. The experiences and outcomes of Atlanta neighborhoods are divided along northeast and southwest lines in nearly every way.

When the highest income neighborhoods are living one and a half times longer than those with the lowest income, these inequities are a matter of life or death.

These are the Top Ten Education Issues to Watch in 2023Image

The Georgia Partnership for Excellence in Education recently published its 19th edition of the Top Ten Issues to Watch Report, informing leaders of Georgia’s most critical education issues.

The issues in this report range from Early Childhood Support and Educator Burnout to School-Community Engagement and Ou-of-School learning. Each of them establishes a goal and a Call to Action laid out in three sections:

  • Invest in people-centered systems
  • Invest in school and community leaders
  • Invest in spreading and scaling local solutions
December 12, 2022 / Basic Needs, Eviction, Housing, Policy

Eviction filings back to pre-pandemic levelsImage

Since the beginning of the pandemic, we’ve been tracking eviction filings from Metro Atlanta counties to understand the time and geographic trends.

It’s clear the federal moratoriums prevented the “eviction tsunami” we heard so much about in 2020 and 2021, but even after the moratoriums, a tidal wave never came.

But as we continue to track the data (currently through November 2022), we’ve seen filing levels steadily rise, matching pre-pandemic levels since late summer.

December 2, 2022 / Education

State of Education in Metro AtlantaImage

On December 1st, Learn4Life held their annual convening to share the factors shaping the state of education in Metro Atlanta.

  1. Interrupted learning from the pandemic is substantial
  2. School districts need our support
  3. Amplification of bright spots is essential
  4. Cradle to career view is necessary

View the data and proposed solutions — including a panel of superintendents answering student questions — in the Facebook Live recording here. And read the full report on L4L’s website.

November 29, 2022 / Economics, Equity

Atlanta has the highest income inequality in the nationImage

In not-new-news, AJC’s analysis of Census data shows Atlanta has the highest income inequality among major US metros.

“[M]any Black residents are not seeing the benefits of [strong economic growth], said Janelle Williams, co-founder of the Atlanta Wealth Building Initiative. The median household income for a Black family in Atlanta is $28,000, while the median income for white families is roughly $84,000. Overall, Black residents account for half of the city’s population.”

This analysis uses the Gini coefficient based on the US Census Bureau’s 2016-2020 American Community Survey data. “The Gini coefficient measures how equally income is distributed among a population and is expressed in a decimal format ranging from zero to one.”

While the City of Atlanta is No. 1 among cities, “the Atlanta metro area ranks as No. 227 for income inequality, with a Gini co-efficient of 0.4708, significantly better than the New York metro area (No. 39) and the Houston metro (No. 117).”

November 29, 2022 / Education, Equity

Combining program and community data reveal insights into barriers to educationImage

The recently launched map of Georgia’s government-funded out-of-school programs highlights some communities with limited access to these learning opportunities. Out-of-school education programs are essential because consistent participation in these activities has been shown to improve academic outcomes, help to close the achievement gap, reduce school absences, and improve social-emotional outcomes. Some of GSAN’s highlights from the interactive map are:

  • 45 counties do not have government-funded programs.
  • Over half of these counties have high concentrations of children living in poverty, low educational attainment rates, low 3rd-grade literacy rates, and limited access to broadband internet and vehicles.
  • A major portion of these counties also fall under Georgia’s Black Belt – a historically underserved region of the state.
November 29, 2022 / Health, Workforce

Long covid leading to more workers with disabilitiesImage

From Liberty Street Economics

  • Approximately 19% of individuals infected with COVID now have long COVID, possibly leading to the 1.7 million increase in working-age people reporting a disability since 2020.
  • Symptoms of long COVID include fatigue, brain fog, and muscle/joint pain. However, explicit tests for long COVID do not exist, making it difficult to confirm a diagnosis.
  • With the increase of disable workers employed, work place accommodations such as avoiding physical exertion or taking rest breaks have become necessary.
  • It is likely that disabled workers suffering from long COVID and the necessary accommodations will be a constant element in the future of the workplace.
Atlanta Public Schools graduation rate by race and ethnicity
October 12, 2022 / Education, Equity

APS graduation rate reaches all-time highImage

Atlanta Public Schools reached an all-time high graduation rate in 2022 of 84.0%.

From the press release:

  • Graduation rates for Black students (82.2%) reached an all-time high with the 2022 cohort, while the rate for Hispanic students (80.0%) and White students (95.4%) was slightly lower than the cohort 2021 rates but higher than the pre-pandemic 2019 rates of 75.5% for Hispanic students and 93.4% for White students.
  • Nearly 13 percentage points separated the graduation rates of Black students and White students. This is 4 percentage points lower than cohort 2021 difference.
  • Graduation rates for students with disabilities was 72.2%, a decrease by 1.6 percentage points over 2021, but the highest number of students with disabilities to ever graduate in one cohort – 309 students.
  • The 2022 graduation rate of 76.1% for English learners was slightly lower than the 2021 graduation rate of 76.8%.
September 13, 2022 / Basic Needs, Economics, Policy, Workforce

Unprecedented decline in child poverty rates attributed to government safety net programsImage

A new report from Child Trends (also covered in the New York Times) evaluates the biggest factors contributing to the unprecedented 30-year trend of decreasing child poverty. Key findings point to governmental safety net programs as key drivers.

Further, the US Census Bureau released pandemic-era child poverty estimates (through 2021) this week, saying “the new data show the significant impact the expansion of anti-poverty programs during the COVID-19 pandemic had on reducing child poverty.”

Additional recent studies, including from our partners at DataHaven in Connecticut found that food scarcity and child poverty rose after safety net programs ended.

What does that mean for social sector leaders?

First, the scale of government interventions offer opportunities to have the greatest impact. But blanket policies will always leave some households falling through cracks: immigrants, mixed-status and undocumented households, families that are newly navigating human services, digitally disconnected, underemployed, housing burdened, and others. Our role then, is (1) advocate for expanded policies and educate officials of the impact; and (2) find and directly serve the families that are left behind.

Second, the new philanthropic role of counties and cities distributing ARPA funds offers an opportunity, and maybe a model, to (1) build relationships with elected officials and (2) provide guidance in funding and programming decisions that have systemic impacts.